Archive for the ‘Research’ Category

Constructing better multivariate biomarker composites

The earliest biomarkers, such a body temperature or blood pressure, were single measurements that reflected multiple physiological processes.  Today, though, our reductionist approach to biology has turned up the resolution of our lens: we can measure levels of individual proteins, metabolites and nucleic acid species, opening the biomarker floodgates.

But this increased resolution has not necessarily translated into increased power to predict.  The principal use of biomarkers after all is to use things that are easy to measure to predict more complex biological phenomena.   Unfortunately, the levels of most individual molecular species are, on their own, a poor proxy for physiological processes that involve dozens or even hundreds of component pathways.

The solution is to combine individual markers into more powerful signatures.   Biomarkers like body temperature allow physiology to perform the integration step.  But for individual molecular biomarkers that job falls to the scientist.

Unsurprisingly, the success of such efforts is patchy – simply because there are an infinite number of ways to combine individual molecular biomarkers into composite scores.  How do you choose between linear and non-linear combinations, magnitude of coefficients and even at the simplest level which biomarkers to include in the composite score in the first place?

The first port of call is usually empiricism.   Some form of prior knowledge is used to select an optimal combination.  For example, I may believe that a couple of biomarkers are more likely to contribute than others and so I may give them a stronger weighting in my composite score.   But with an infinite array of possible combinations it is hard to believe that this approach is going to come anywhere close to the optimum combination.

Unless you have a predictive dataset, however, this kind of ‘stab in the dark’ combination is the best you can do.  Just don’t be surprised if the resulting composite score is worse than any of the individual biomarkers that compose it.

With a dataset that combines measurements of each individual biomarker and the outcome being modeled, more sophisticated integration strategies become possible.  The most obvious is to test each individual marker in turn for its association with the outcome and then combine those markers that show a statistically significant association.  Perhaps you might even increase the weighting of the ones that are most strongly associated.

But how powerful are these ad hoc marker composites?

From a theoretical perspective, one might imagine the answer is not very powerful at all.  While common sense suggests that each time you add another marker with some new information in it the predictive power of the composite should improve, unfortunately this simple view is too, well, simple.   Each new marker added into a composite score contributes new information (signal) but also further random variation (noise).  To make a positive contribution, the additional signal has to be worth more than the additional noise.

Even when the data is available, asking whether each marker is significantly associated with outcome to be predicted is therefore only looking at one half of the equation: the signal.  It does little to quantify the noise.  Worse still, it doesn’t address whether the signal is “new” information.  Too often, the individual markers used to construct a composite are correlated with each other, so the value of each new marker is progressively reduced.

In sharp contrast, the random noise from different markers is rarely, if ever, correlated.  So each added marker contributes a full shot of noise, but a heavily diluted dose of signal.   Making biomarker composites more powerful than the best single marker is therefore no trivial exercise.

Here is a real-world example from Total Scientific’s own research that nicely illustrates the problem.  Angiography is widely used to visualize the coronary arteries of individuals suspected of having coronary heart disease.   The idea is to identify those at high risk of a heart attack and to guide interventions such as balloon angioplasty, stenting and bypass grafting.   In this respect, the angiogram represents a perfect example of a biomarker composite.  Measures of stenosis in all the major coronary artery regions are to be used to predict a clinical outcome (future heart attack).

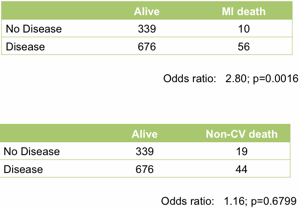
At the top level it works well.  Treating the angiogram as a single marker yields useful prediction of future outcome.  Those with coronary artery disease are (unsurprisingly) at much higher risk of heart attack (Figure 1).

Association between death and angiography

Figure 1.  Association between the presence of disease detected by angiography and death following a myocardial infarction (upper table) or death unrelated to cardiovascular disease (lower table).  All data from the MaGiCAD cohort with median follow-up of 4.2 years.

As a useful control, the presence of coronary artery disease is not associated with death from non-cardiovascular causes.  Perhaps the most striking thing about this data, though, is the size of the effect.  People with a significant coronary artery stenosis are only at 3-fold excess of risk of dying from a heart attack in the following four years compared to those with no significant disease by angiography.

Is there more data in the angiogram?  For example, does the total amount of disease or even the location of the lesions provide better prediction of who will go on to suffer a fatal heart attack?  To address this question, we need to treat the angiogram as a collection of separate markers – a measurement of stenosis in each individual coronary artery region.

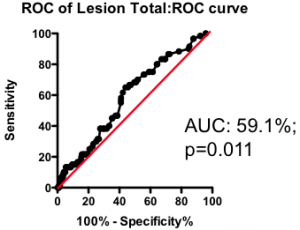
Among those with some disease, the total amount of atherosclerotic plaque does have some further predictive value (Figure 2).  But again, the most striking observation is the weak nature of the association.  Having a lot of disease versus a little puts you at only marginally greater risk of the fatal heart attack – the total amount of disease cannot be used as a guide as to where intervention is clinically justified.

ROC for total lesion score

Figure 2.  Receiver-Operator Characteristic (ROC) curve using total lesion score to predict death as a result of a myocardial infarction (in the “diseased’ group only).  Total lesion volume is better than chance (which would have an AUC of 50%; p=0.011) but carries very little predictive power (a perfect test would have AUC = 100%, and each increment in AUC is exponentially more difficult to achieve).

If the total amount of disease has so little predictive power, does the location of the disease provide a more clinically useful guide?  Previous researchers have attempted to incorporate the location of the lesions into a biomarker composite score.  One example is the Jeopardy Score that assigns weights to disease in different regions of the arterial tree according the proportion of myocardial perfusion that would be lost due to a blockage in that region.  Plaques in proximal locations that cause a greater perfusion deficit ought, in principle, to be more dangerous than stenosis in more distal regions.

ROC for jeopardy score

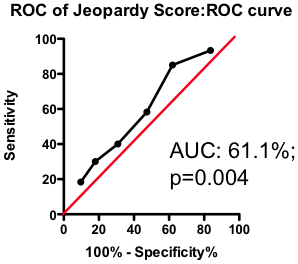
Figure 3.  ROC curve using Jeopardy Score to predict death as a result of a myocardial infarction.

Testing this biomarker composite, though, yields disappointing results (Figure 3).  The composite is no better than a simple sum of all the lesions present (compare Figure 2 and Figure 3).   More lesions (wherever they are located) will tend to increase Jeopardy Score, so its unsurprising that Jeopardy Score performs at least as well as the total extent of the disease.  But it is clear that the additional information about the perceived risk of lesions in different portions of the vascular had no further predictive value.

Does this mean that future risk of fatal heart attack is independent of where the lesions are located?  Not necessarily.  The Jeopardy Score biomarker composite was assembled based on a theoretical assessment of risk associated with proximal lesions.  But are proximal lesions really more risky?

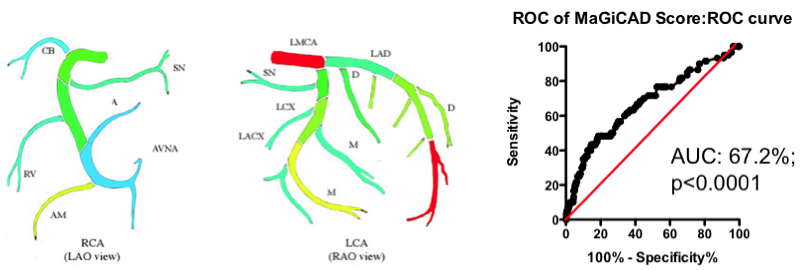
Yes and no.  Using the MaGiCAD dataset, we have constructed ‘heat maps’ showing where lesions were most likely to be located among the individuals who died from a heart attack during follow-up, compared with those who did not (Figure 4).  As expected, the left main stem (which feeds both the left anterior descending artery and the circumflex artery) was the site of the most dangerous plaques.  But the next most dangerous location was the distal portion of the circumflex and left anterior descending arteries.

Using this information create a revised Jeopardy Score based on the observed risk in the MaGiCAD dataset now yields a model that significantly improves on the published Jeopardy Score based on theoretical approximation (Figure 4; right panel).  This suggests there really is useful information encoded in the position of the lesions within the arterial tree.

Artery heat map and ROC curve for new weightings

Figure 4.  Left Panel: Heat map of the coronary artery tree showing the relative lesion volume among individuals who died following an MI during follow-up compared to those alive at the end of follow-up.  Dark red represents a 3-fold excess lesion volume among the cases; dark blue represents a 3-fold excess lesion volume among the controls.  Note that the highest risk lesions are located in the left main stem (LMCA), with risk graded from distal to proximal in the left anterior descending (LAD) and circumflex (LCX) arteries, while risk is graded from proximal to distal in the right coronary artery (RCA).  Right Panel: ROC curve using the weightings from the heat map (left panel) to predict death as a result of a myocardial infarction.

Is this the best predictive model you can generate?  Almost certainly not – it turns out that the location of the most dangerous lesions depends on other factors too.  The left main stem is dangerous in younger men (justifying its colloquial designation as the ‘widowmaker’) – but in men over the age of 65 and in women lesions in the left men stem are no more dangerous than those elsewhere in the arterial tree.

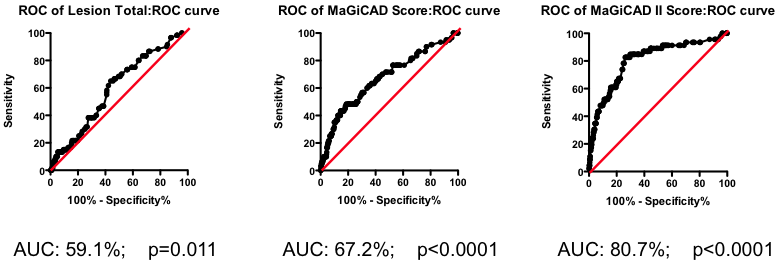
Mathematical tools exist to create optimized models combining all these different factors.  One example is the Projection to Latent Structures (or PLS) implemented using SIMCA.  Constructing a PLS model from the MaGiCAD data yields a yet more predictive model (Figure 5; right panel).  Figure 5 illustrates the gradual improvement in the performance of the biomarker composite as more sophisticated algorithms are used to weight the component markers.

All this nicely illustrates how data-driven optimization of biomarker composites can dramatically improve predictive power.  But it does not (yet) give us clinically useful insight.  Because the models have been derived using the MaGiCAD dataset, the ability to predict outcomes in the MaGiCAD cohort (so-called ‘internal predictions’) is likely to be artificially high.  This is particularly true of the PLS model, because PLS is a ‘supervised’ modeling tool (in other words, the algorithm knows the answer it is trying to predict).  Before we can start to use such a biomarker composite clinically, we need to test its ‘generalizability’ – how good it is at predicting death no matter where the angiogram was performed.

Evolution of the model

Figure 5.  Series of ROC curves demonstrating the improvement in predictive performance with more advanced algorithms for weighting the component markers derived from the angiogram.  Right Panel: ROC curve using the weightings from the PLS model of the MaGiCAD angiography dataset to predict death following a myocardial infarction.

Why might the model not be generalizable?  One obvious reason is that the outcome (death following myocardial infarction) may have been modulated by the intervention of the clinicians who performed the angiography – using the information in the angiogram itself.  It is perfectly possible that distal lesions appear to be the most risky precisely because clinicians perceive proximal lesions to carry the most risk and so treat proximal lesions more aggressively than distal ones.  If that were true, all our heat map would represent is the profile of intervention across the coronary artery tree rather than anything about the underlying biology.  Since patterns of interventions may vary between clinical teams, our highly predictive biomarker composite may apply uniquely to the hospital where the MaGiCAD cohort was recruited.

If this example does not provide all the answers, it should at least provide a list of questions you should ask before adopting published biomarker composites.  Just because a particular composite score has been used in many studies previously you should not assume it represents an optimal (or even a good) combinatorial algorithm.  Usually, combinations are assembled on theoretical (or even ad hoc) grounds and rarely are different combinations considered and compared.

Nor should you assume that combination of component markers will automatically be more powerful than any of the individual markers.  Because the noise in different markers is rarely correlated, but the signal component is more often than not highly correlated, the act of combination inherently reduces power, unless it has been done very carefully.

Before adopting a biomarker composite as an end-point in a clinical trial, you need to understand which components are contributing the greatest noise and which contain the dominant signal.  The results of such an analysis may surprise you.

But most importantly of all, you should recognize that the superficially straight-forward task of combining individual biomarkers is not a task for the uninitiated.  Injudicious combination will reduce rather than increase your power, and even with the most powerful statistical tools available today developing superior biomarker composites is a slow and painstaking task, with no certainty that the composite score that emerges will be much superior to its components.  In short, biomarker composites are more likely to be your problem than your solution.

David Grainger
CBO, Total Scientific Ltd.

Combinatorial animal study designs

It is sometimes assumed that government regulations governing the use of animal models in drug development hamper good science, either by accident or design. But reality is rather different: focus on the 3Rs of replacement, reduction and refinement can lead to more reliable results, quicker, at lower cost and with improved animal welfare and reduced animal use as well.

There are a number of strategies that can reduce the number of animals used during the development of a new drug. The most obvious is to combine several types of study, investigating efficacy, safety and drug disposition simultaneously. As well as reducing the number of animals required, it has scientific benefits too: instead of relying on measuring drug levels to assess exposure, you can observe the safety of the drug in exactly the same animals where efficacy is investigated. For drugs with simple distribution characteristics, measuring exposure in the blood is useful for comparing different studies, but as soon as the distribution becomes complex (for example, with drugs that accumulate in some tissues, or are excluded from others) comparing different end-points in different studies becomes challenging and fraught with risk of misinterpretation.

Quite simply, then, its simply better to look at safety and efficacy in the same animals in the same study. The results are easier to interpret, particularly early in drug development when knowledge of distribution characteristics may be imperfect. Not only is it scientifically better, but it reduces the use of animals, and it reduces the overall cost of obtaining the data. A combination study may be as much as 30% cheaper than running two separate studies.

For these reasons, Total Scientific plan to launch in 2012 a comprehensive range of combination study packages, combining our industry-standard models of chronic inflammatory diseases with conventional assessment of toxicity, including clinical chemistry, haematology, urinalysis, organ weights and histopathology. For anyone involved in early stage drug development in immunology and inflammation, these study designs will offer more reliable de-risking of an early stage programme at a lower cost than conventional development routes.

If the data is better and the costs are lower, why haven’t such combination designs become the norm before now? Perhaps its because of a misunderstanding of what kind of safety information is needed during the early stages of developing a first-in-class compound. Conventional toxicology (such as that required for regulatory filings) requires driving dosing levels very high to ensure that adverse effects are identified. Clearly, for a drug to be successful, the adverse events must be occurring at much higher doses than the beneficial effects – which is at odds with a combination study design.

That’s fine once you have selected your clinical candidate (and conventional toxicology studies of this kind will still be needed prior to regulatory submission even if you ran a combination study). But for earlier stage development, the combination design makes perfect sense: before you ask how big the therapeutic index might be, first you simply want to know whether it is safe at the doses required for efficacy.

A previous blog by DrugBaron has already commented on the over-focus on efficacy in early drug development as a contributor to costly attrition later in the pipeline. Why would you be interested in a compound that offered benefit but only at doses that cause unacceptable side-effects (whether mechanism-related or molecule-specific it matters not)? Continuing to invest either time or money in such a compound ignorant of the safety issues until later down the path is a recipe for failure.

Looking at early stage opportunities being touted for venture capital investment paints a similar picture: almost all have, as their centerpiece, a compelling package of efficacy data in one (or often several) animal models. Far fewer have any assessment of safety beyond the obvious (that the animals in the efficacy studies survived the treatment period). Since almost any first-in-class compound, by definition hitting a target unvalidated in the clinic, is associated with “expected” side-effects, this lack of any information to mitigate that risk is the most common reason for failing to attract commercial backing for those early stage projects. Total Scientific’s combination study designs rectify these defects, reducing risk earlier, and at lower cost.

Why stop there? Relatively simple changes to the study design also allow investigation of pharmacokinetics, metabolism and distribution – all in the same animals where efficacy and safety are already being investigated. Such “super-studies” that try and address simultaneously many different aspects of the drug development cascade may be unusual, and may not provide definitive (that is “regulator-friendly”) results for any of the individual study objectives. However, in early stage preclinical development they will provide an extremely cost-effective method of identifying potential problems early, while reducing use of animals still further.

Combining different objectives into one study is only one way Total Scientific refines animal model designs in order to reduce animal requirements. Being biomarker specialists, we can improve the phenotyping of our animal models in several different ways. Firstly, by using multiple end-points (and an appropriate multi-objective statistical framework) we can detect efficacy with fewer animals per group than when relying on a single primary end-point. There can be no doubt that a single primary end-point design, used for regulatory clinical studies for example, is the gold-standard – and is entirely appropriate for deciding whether to approve a drug. But once again its not the most appropriate design for early preclinical investigations. It’s much better to trade a degree of certainty for the extra information that comes from multiple end-points. In any case, the consistency of the whole dataset provides that certainty in a different way.

Learning how a new compound affects multiple pathways that compose the disease phenotype provides a lot of additional value. In respiratory disease, for example, understanding whether the effect is similar on neutrophils and eosinophils, or heavily biased towards one or the other provides an early indication as to whether the compound may be more effective in allergic asthma or in severe steroid-resistant asthma. Compounds that hit multiple end-points in an animal model are much more likely to translate to efficacy in the clinic.

Equally importantly, we focus on end-points that have lower inter-animal variability – and hence greater statistical power. There is a tendency for end-points to become established in the literature simply on the basis of being used in the first studies to be published. Through an understandable desire to compare new studies with those that have been published, those initial choices of end-points tend to become locked in and used almost without thinking. But often there are better choices, with related measures providing similar information, but with markedly better statistical power. This is particularly true of semi-quantative scoring systems that have evolved to combine several measures into one number. Frequently, most of the relevant information is in one component of the composite variable, while others contribute most of the noise – destroying statistical power and requiring larger studies.

What all these refinements have in common is that they improve the quality of the data (driving better decisions), while reducing the number of animals required on the other (with ethical and cost benefits). Its not often you get a win:win situation like this – better decisions typically cost more rather than less. But the forthcoming introduction of Total Scientific’s new range of preclinical model study designs promises benefits all round.

Dr. David Grainger
CBO, Total Scientific

Chemokines as biomarkers for cancer: Time to revisit an old friend?

A wide-ranging study pre-published on-line in Nature last month points the finger at the chemokine CCL2 (also known as MCP-1, or JE in mice) as a key regulator of tumour metastasis.  Intriguingly, CCL2 seems to participate in the generation of clinically-relevant metastatic disease on multiple levels: it promotes seeding of the shed metastatic cells, but it also promotes establishment and growth of the micrometastases, a process that is dependent on VEGF production from a tissue macrophage subset that responds to CCL2.  All this nicely suggests that CCL2 (and its signaling pathway) may be an attractive therapeutic avenue for reducing the risk of metastasis.  The close links between the academic authors and the global pharmaceutical company Johnson & Johnson suggests that this avenue is already being aggressively pursued.

But what about CCL2 as a biomarker for detecting early metastasis and directing treatment?  The study shows that the density of CCL2-expressing macrophages in the region of the metastasis is associated with disease progression, so it seems plausible that measuring CCL2 levels in appropriate biological samples (whether tissue or blood) might be a productive investigation.

All this has special resonance for scientists at Total Scientific.  A decade ago, similar data (here and here) linking CCL2 to the mechanism of atherosclerosis and vascular restenosis prompted us, among others, to investigate whether circulating levels of CCL2 might be predictive of coronary heart disease.

The bottom-line finding (that CCL2 levels in serum are not linked to heart disease) was disappointing.  But the process of getting to that conclusion was highly instructive.  CCL2 binds to blood cells through both high affinity (receptor) interactions and lower affinity (matrix) associations.  The amount of CCL2 bound to signaling receptors is essentially irrelevant for the measurement of CCL2 in blood, but the lower affinity associations turned out to be much more significant.  As much as 90% of the CCL2 in blood is bound to the enigmatic Duffy antigen on red blood cells (enigmatic because this receptor seems to be related to chemokine receptors but lacks any kind of signaling function).   Worse still, this equilibrium is readily disturbed during the processing of the blood sample: anticoagulants such as heparin or EDTA shift the equilibrium in one direction or the other altering apparent CCL2 levels.  Minor variations in the sample preparation protocol can have dramatic effects on the measured levels – whether between studies or within a study – not a good sign for a biomarker to achieve clinical and commercial utility.

And it’s not only ex vivo variables that affect the equilibrium: red blood cell counts differ between subjects, with women typically having lower red blood cell counts and lower total CCL2 levels as a result.  Since women also have lower rates of heart disease, a widespread failure to recognize the complexity of measuring CCL2 in blood fractions most likely contributed to a number of false-positive studies.    Needless to say, almost a decade on from those positive studies, CCL2 has not found a place as a biomarker for heart disease probably because, as we discovered, the reported associations had their origins in a subtle measurement artifact.

Does this mean CCL2 is unlikely to be a useful biomarker for metastatic potential among cancer sufferers?  Not at all.  But it does mean that studies to investigate the possibility will have to be much more carefully designed than is typically the case.  Learning from our previous experiences studying CCL2 levels in heart disease patients, the Total Scientific team has assembled the necessary tools to address this question in cancer.

However, an old adage among biomarker researchers comes to mind: “If it looks simple to measure, it probably means you don’t know enough about it”.

Dr. David Grainger
CBO, Total Scientific Ltd.

The final frontier – post-genomic biomarkers

Some biomarkers are easier to find than others.  Once a class of molecules has been noticed, and the assay methodology to measure their levels has been optimized, data rapidly accumulates.  Related molecules frequently pop up (often as a result of artifacts appearing in the assays under certain conditions or when particular samples are analysed).  Its rather like unearthing an ancient pyramid – if the first dig identifies the tip of the pyramid, the rest follows quite quickly.

But imagine what it would be like trying to rebuild the pyramid if the blocks had been scattered over a wide area.  Finding one block wouldn’t necessarily help you find the next one.  That seems to be the case with the ever-growing superfamily of peptide modifications.  A trickle of discoveries of naturally occurring modifications of peptides is turning into a flood.  And the molecules that are being discovered seem to be associated with fascinating biology, and offer great promise as biomarkers now and in the future.

Modifications such as phosphorylation, sulphation, glycosylation and more recently glycation have been so extensively studied that they are taken for granted as part of the molecular landscape.  But the molecular diversity they generate is still under-appreciated.  Total Scientific have comprehensively analysed the unexpected array of natural antibodies against the oligosaccharides that decorate many extracellular proteins and peptides – and extended initial observations by others that changes in these anti-carbohydrate antibodies are useful biomarkers for the early stages of cancer development in man.  But even these studies, using multiplexed assays to profile the portfolio of anti-carbohydrate antibodies, hardly scratch the surface of the molecular diversity that exists in this domain.

Over the last decade the range of covalent tags on peptides and proteins has expanded much further.  The ubiquitin family of small peptide tags now numbers at least 46, and these can be added to proteins in a staggering variety of chains, ranging from a single ubiquitin tag to branched chains of different ubiquitin family members.  These modifications play central roles in diverse biological pathways, from cell division and organelle biogenesis to protein turnover and antigen presentation.  Our understanding of the importance of ubiquitinylation is progressing rapidly, but in the absence of good methodology to differentiate the vast diversity of tag structures the possibilities that proteins and peptides modified in this way may be valuable biomarkers is all but unexplored.

Covalent tags, such as phosphorylation, ubiquitination or nitrosylation, are not the only natural modifications of peptides now known.  More surprisingly, mechanisms exist to modify the amino acids composing the peptide chain itself.  Some seem highly specific for a single metabolic pathway (such as the formation of S-adenosylmethionine in the folate cycle controlling methyl group transfer); others at least seem limited to a single class of protein targets (such as lysine acetylation in histones to regulate the strength of DNA binding); but more recently it has become clear that enzymes exist to modify peptidyl amino acid side chains in a wide range of different substrates.  The best-studied example is the enzyme peptidyl arginine deiminase (PAD), which converts arginine in peptides and proteins into citrulline.  This unusual reaction only came to light because of the misregulation of PAD that occurs in almost all cases of rheumatoid arthritis (RA).  Dysregulated PAD activity in the extracellular space results in the generation of hundreds of different citrulline-containing proteins and peptides, many of which are immunogenic.  This, in turn, results in the formation of antibodies against citrulline-containing protein antigens (called ACPAs or anti-CCPs).  Diagnostic kits measuring anti-CCP levels have revolutionized the clinical diagnosis of RA, almost completely supplanting the use of rheumatoid factor, which has poorer sensitivity and specificity.  Today, the presence of anti-CCP antibodies is almost pathomnemonic for classical RA, and sales of the proprietary kits for measuring this biomarker are generating millions annually for their discoverers.

Conversion to citrulline is not the only fate for arginine residues in peptides and proteins.  In bacteria, conversion of arginine to ornithine is a key step in the generation of self-cleaving peptides called inteins.  Intriguingly, one of Total Scientific’s clients has recently discovered an analogous pathway in eukaryotes (including humans) that generates naturally occurring lactam-containing peptides, and we are helping them generate new assay methodology for this novel and exciting new class of potential biomarkers.

Even simpler than covalent tagging and metabolic transformation of the amino acid side chains is simple cleavage of the peptide or protein.  Removal of a handful of amino acids from the N-terminus (by dipeptidyl peptidases) or the C-terminus (by carboxypeptidases) of peptides can already generate hundreds of different sequences from a single substrate peptide.  Endoproteolytic cleavage at specific internal sites generates further diversity.  The problem here is that both the product and the substrate contain the same sequence, making the generation of antibodies specific for a particular cleavage product very difficult to generate.  Total Scientific are developing generally-applicable proprietary methods for successfully raising antibodies specific for particular cleavage products, and these tools should greatly accelerate the growing field of biomarkers that are specific cleavage products (such as the use of N-terminally processed B-type Naturetic Peptide, or ntBNP for the diagnosis of heart failure).

If the detection of different, closely related, cleavage products from a single substrate is a challenging analytical conundrum, then the specific detection of particular non-covalent aggregates of a single peptide or protein is surely the ultimate badge of honour for any assay developer.  Recent data suggests that some peptide hormones, such as adiponectin, may signal differently when aggregated in higher molecular weight complexes compared to when present in lower molecular weight forms.

Frustratingly, none of this wealth of diversity in the potential biomarker landscape is captured in the genome.  The glittering insights of the vast space beyond this post-genomic biomarker frontier have mostly come from fortuitous stumbling across a particular example.  But the sheer frequency with which such discoveries are now being made suggests there is a substantial horde of buried treasure out there waiting for us to develop the appropriate analytical tools to find it.  Total Scientific have built up an impressive toolkit, capable of shining a flashlight into the darkest corners of the post-genomic biomarker space and we relish any opportunity to turn this expertise into exciting new biomarker discoveries for our clients.

Dr. David Grainger
CBO, Total Scientific Ltd.
Finding exogenous biomarkers of heart disease: humans are ecosystems too!

It is ten years this week since the Total Scientific team, together with our collaborators at Imperial College in London submitted the first large-scale clinical metabolomics study for publication in Nature Medicine.  We applied proton NMR spectroscopy to serum samples collected from patients with coronary heart disease (defined by angiography), as well as control subjects with normal coronary arteries.  The results were dramatic: we could completely separate the groups of subjects based on the coronary artery status using a non-invasive blood test.

Despite such encouraging findings, the implications of that ground-breaking study have yet to impact clinical medicine.  There are a number of reasons for that: in 2006, a replication study was published, again in Nature Medicine, with some misleading conclusions.  Although they saw broadly the same patterns that we have observed five years previously, they interpreted their reduced diagnostic power as a negative outcome – though in reality its source was most likely the inappropriate concatenation of samples from different studies, collected with different protocols.

But another limitation of our study has its origin in the techniques we applied.  NMR spectroscopy is an amazingly reproducible analytical technique, but it has poor sensitivity (so misses many low abundance biomarkers) and, perhaps more crucially, it can be difficult to determine the exact molecular species responsible for the differences between groups of subjects.

In our study, the majority of the diagnostic power arose from a peak with a chemical shift around 3.22 ppm, which we attributed to the trimethylamine group in choline.  Individuals with angiographically-defined heart disease have much lower levels of this signal compared with healthy subjects.  Although we speculated that the signal might arise due to phosphatidylcholine residues in HDL, the lack of certainty about the molecular identity of this powerful diagnostic marker (that was clearly replicated in the 2006 study) hampered further investigation.

Then, last month, Wang and colleagues published a fascinating follow-up study in Nature.  Using LC-MS based metabolomics they identified three metabolites of phosphatidylcholine as predictors of heart disease (choline, TMAO and betaine).  In a stroke, they replicated our earlier findings and provided additional clarity as to the molecular nature of the biomarkers.  It has taken a decade to move from the realisation that there was a powerful metabolic signature associated with heart disease to an unambiguous identification of the molecules that are responsible.

Are measurements of these metabolites useful in the clinical management of heart disease?  That remains an open question, but with the molecular identity of the biomarkers in hand it is a question that can be readily investigated without the need for complex and expensive analytical techniques such as NMR and LC-MS.

But Wang and his colleagues went one step further: they showed that these biomarkers were generated by the gut flora metabolizing dietary phosphatidylcholine.  So the signature we originally published in 2002 may not represent differences in host metabolism at all, but actually reflect key differences in the intestinal flora of subjects with heart disease.  All of which serves as a useful reminder that we humans are complex ecosystems, and our biochemistry reflects much more than just our own endogenous metabolic pathways.

Metabolomics is an incredibly powerful platform for the discovery of new biomarkers, as this decade-long quest has demonstrated.  And the pathways it reveals can lead in the most surprising of directions.

Dr. David Grainger
CBO, Total Scientific Ltd.
Biomarkers: lessons from history

The increase in the use of the term biomarker is a recent one.  When one looks back at the use of this term in the literature over the last fifty years, there was an explosive increase in its use in the 1980s and 1990s, and it continues to grow today.  However, biomarker research as we now know it has a much deeper history.

Here we are going to focus on just one paper, published in 1965, twelve years before the term “biomarker” appeared in either the title or abstract of any paper in the PubMed database[i].  This is a paper by Sir Austin Bradford Hill, which appeared in the Proceedings of the Royal Society of Medicine entitled “The Environment and Disease:  Association or Causation?”.

Sir Austin neatly and eloquently describes nine factors that he feels should be taken into account when assessing the relationship between an environmental factor and disease.  These are:

  1. Strength
  2. Consistency
  3. Specificity
  4. Temporality
  5. Biological gradient
  6. Plausibility
  7. Coherence
  8. Experiment
  9. Analogy

In this blog we discuss the applicability of each of these factors to biomarker research today.  However, before we do, it is important to note that the aims of biomarker research today are much broader than the primary aim of Sir Austin’s paper – which was to discuss the ways in which an observed association between the environment and some disease may be assessed for the degree of causality involved.  However, only a very few biomarkers lie directly on this causal path (some biomarkers change in response to the disease itself, others are only indirectly associated with the disease and its causes), but crucially their utility does not depend upon a causal association.  However, particularly when biomarkers are used to aid the identification of disease, there are clear parallels between Sir Austin Bradford Hill’s assessment of causality and our current need to assess utility.

1.  Strength. Sir Austin’s primary factor to consider in the interpretation of causality was the strength of the association.  He argues that the stronger the association between two factors, the more likely it is that they are causally related.  However, he cautions against the obverse interpretation – that a weak association implies a lack of causality.  In fact, the strength of an association depends on the proportion of the variance in one factor that explained by the other over the relevant sampling timescale.  In other words, there may be a completely causal relationship between X and Y, but X may be only one factor (possibly a small factor) controlling Y.  The remaining variance in Y may even be random fluctuations (so X is the only factor causally associated with Y), yet the strength of the observed association will be weak, unless time-averaged measurements are taken for both variables.

The strength of the association is probably an even more important factor for assessing the utility of biomarkers than it was for assessing causality.  Firstly, it is clear to all that the stronger the association between a putative biomarker and the disease under examination, the more likely it is to have clinical application.  However, as with the arguments for causality there are important caveats to insert.  The clinical utility of a putative biomarker often depends upon the shape of the receiver-operator curve, not just the area underneath the curve.  For example, a test where the specificity remains at 100%, even with lower sensitivity may have far more clinical utility than a test where both sensitivity and specificity are 90% – depending on the application – even if the overall strength of the association was weaker.

It’s also possible to improve the strength of a crude association, for example by subsetting the patient population.  A given biomarker may perform much better in, say, males than females, or younger people rather than older people.  The applicability of the biomarker may be restricted but the strength, and hence clinical utility of the association may be improved dramatically.  But despite these caveats, the strength of the association is a good “first pass” screening criterion for assessing the utility of biomarkers – much as for Sir Austen it yielded a good “first guess” as to whether an association was likely to be causal

2.  Consistency.  Sir Austin Bradford Hill puts this essential feature of any biomarker programme second on his list of causality factors.  He states “Has [it] been repeatedly observed by different persons, in different places, circumstances and times?”.  This is an absolutely crucial issue, and one on which many a biomarker programme has failed.  One only has to look at the primary literature to realise that there have been dozens of potential biomarkers published, of which most have not been validated, as indicated by the lack of positive follow-on studies.  Much of this attrition can be put down to study design, something that was discussed in an earlier blog.

3.  Specificity. The discussion of specificity by Sir Austin Bradford Hill is also highly relevant to today’s biomarker research.  We live in an  ’omics world’, with the ability to measure levels of dozens, hundreds or even thousands of potential biomarkers with an ease that must have seemed like science fiction in 1965.  As a result, it is often trivial (in both the technical logical sense of the word as well as the everyday use) to identify a biomarker apparently associated with a disease.  Consider, however, how a marker of inflammation might behave:  they will likely be strongly associated with any selected inflammatory disease, but they are unlikely to have any specificity over other inflammatory conditions.  For example, serum levels of C-reactive protein correlate well with rheumatoid arthritis, but because it is also associated with dozens of other inflammatory conditions it has little clinical utility for the diagnosis of RA (although, of course, it may be useful for monitoring disease activity once you have secured a robust differential diagnosis by other means).  Again, this raises the issue of study design: preliminary studies are often set up with the aim of identifying differences in levels of biomarkers between subjects with disease and healthy controls.  Such studies may provide a list of candidates, but ultimately most of these will not show adequate specificity, an issue identified when a more suitable control population is used.

4.  Temporality. This is perhaps the most obvious of Bradford-Hill’s concepts: for a causal relationship between X and Y, changes in X must precede changes in Y.  Similarly, it is more useful in disease diagnosis when a biomarker changes before the disease is manifestly obvious.  On the face of it, the earlier the change can be detected before the disease exhibits clinically-relevant symptoms, the more useful that advance warning becomes.  In the limit, however, differences that are exhibited long before the disease (perhaps even for the whole life of the individual, such as genetic markers) become markers of risk rather than markers of the disease process itself.

5.  Biological gradient.  This feature of biomarker studies is just as important as it was when Sir Austin discussed it in relation to the causality of associations.  Our assessment of the utility of a biomarker increases if there is a dose-response association between levels of the biomarker and presence or severity of disease.  So, examining colorectal cancer for example, one might give greater weight to a biomarker whose levels are elevated somewhat in patients who have large polyps and strongly elevated in patients who have overt cancer.  A gradient of elevation across patients with different stages of cancer would also add to the plausibility of the putative biomarker (see below)

6.  Plausibility. Of all of the criteria put forward in the paper by Sir Austin Bradford Hill back in 1965, we find this is the most interesting.  Prior to the ’omics era, the majority of experimental designs were already based on a hypothesis of some sort – that is plausibility was inherently built-in to all experiments, just because the act of measuring most analytes or potential biomarkers was expensive in both time and money.  To Sir Austin, it must have been the norm rather than the exception that observed associations had at least a degree of plausibility.

In the modern era this is no longer the case.  Thousands of genes, metabolites or proteins may now be examined in a very short period of time and (for the amount of data obtained) at a very reasonable cost.  And because recruiting additional subjects into a clinical study is typically significantly more expensive than measuring an additional analyte or ten, one often finds that the resulting dataset for most modern studies is “short and fat” – that is, you have measured many more analytes (variables) than you had patients (observations) in the first place.  Moreover, there is often no particular reason why many of the analytes have been measured – other than the fact that they composed part of a multi-analyte panel or some pre-selected group of biomarkers.  Post-hoc justification becomes the norm.  It is almost impossible to avoid.  We find a few “statistically significant” differences[ii], and then rush to explain them either from our own background knowledge or by some hurried literature searches.  The sum of biological knowledge (or at least published data) is orders of magnitude greater than it was in Hill’s day, and nowadays it is entirely undemanding to construct a plausibility argument for any association one might find in such a trawl.

We caution strongly against this approach, however.  Tempting though it is to take this route, the likelihood that any biomarkers identified in such experiments have any validity is almost nil, and enthusiastic but unwitting over-interpretation is often the outcome.  This does not mean that such dataset are cannot be mined successfully, but doing so is a job for a professional, wary of the pitfalls.  And no such biomarker should be considered useful until it has been validated in some well-accepted manner.

Interestingly, from the perspective of 1965, Sir Austin Bradford-Hill came to the conclusion that it would be “helpful if the causation we suspect is biologically plausible”, but today we do not share that perspective.  Armed with so much published data, an argument for plausibility can be built for any association – this lack of specificity therefore means that such plausibility has little predictive value as a criterion for assessing utility.  He did, however, state that from the perspective of the biological knowledge of the day, an association that we observe may be one new to science and it must not be dismissed “light-heartedly as just too odd.”  This holds true as much today as it did then.  When faced with two associations, one plausible and one off-the-wall, the criteria of plausibility is not necessarily the primary criterion that we apply to determine utility.

7.  Coherence.  Similar to plausibility, this criterion highlights that while there may be no grounds to interpret something positively based on currently available biological knowledge, there may nevertheless be reason to doubt data based on existing scientific evidence.  The arguments against using coherence to assess utility of candidate biomarkers are the same as for plausibility.

8.  Experiment.  This is another crucial factor that is just as relevant in today’s world of biomarkers as it was in 1965.  Sometimes the fields of diagnostic medicine and experimental biology are not as well integrated as they should be.  Interpretation of biomarker identification or biomarker validation experiments is often limited by the availability of samples or data.  However, there is much to be said for taking the information learnt in the examination of biomarkers in patients back to the bench.  Here much tighter control may be applied to your experimental system, and hypotheses generated in vivo may be tested in vitro.  This may seem back-to-front, but it is an essential feature of any well-designed biomarker programme that it be tested experimentally.  This may be possible in patients, but it may often be carried out more cheaply and quickly at the bench or in animal models of disease.

9.  Analogy. Analogy falls into the same category as plausibility and coherence.  The huge range of published data, much of which is carried out poorly and / or not followed through means that testing the validity of a finding by analogy to existing biological knowledge is becoming ever more difficult.  It is not analogy that’s needed, but consistency – and that means more well-designed experiments.

Perhaps it’s time to bring Bradford-Hill’s criteria bang up to date for the 21st Century?  Much of his pioneering work applied to assessing causality between environmental factors and disease is just as valuable in assessing modern biomarkers for clinical utility.  For the initial assessment of biomarkers, as data begins to emerge from the first discovery studies it is consistency and specificity that carry the greatest weight, with temporality, strength of the association and biological gradient only a short distance behind.  The key is to design efficient studies that allow each of these critical parameters to be assessed at the earliest stages of the biomarker discovery programme – too often biomarkers are trumpeted as ready for use before this checklist has been completed, and quite often before any experiment has even been conceived of that might properly test each of them.

Experiment is a crucial component of the eventual validation of any biomarker, but the effort involved means that preliminary prioritization of candidate biomarkers will likely have to be undertaken without it.  Our Total Scientific Criteria (with appropriate deference to Sir Austin Bradford Hill) for assessing the utility of biomarkers might look something like this:

  1. Consistency
  2. Specificity
  3. Temporality
  4. Strength
  5. Biological gradient

There may be inflation in almost everything in the modern world, but at least when it comes to criteria for judging the utility of biomarkers we have gone from nine criteria to just five.  The pleasures of living in a simpler world!

Dr. David Mosedale and Dr. David Grainger
CEO and CBO, Total Scientific Ltd.


References

[i] Source:  PubMed search carried out in March 2011.

[ii] We are deliberately avoiding discussion of what might be statistically significant in such a short and fat dataset.  Interestingly, Sir Austin’s paper finishes with a discussion on statistical tests, and their potential overuse back in 1965.  This is well worth a read!

Return top

Total Scientific

Total Scientific Ltd. is a contract research organisation that specialises in biomarkers.

The use of biomarkers is playing an ever-increasing role in both the pre-clinical and clinical phases of drug discovery, as well as its more traditional role as a core activity for many diagnostic companies. From target identification and validation, through pre-clinical and early clinical phases, the ability to predict or follow drug effects in vivo can significantly reduce the cost and time taken to develop new drugs.